Hello and welcome to Open Citizen Data Science!
Today we will see how to harness the power of Open Street Map for geolocalized analysis:
First of all, let's get the dataset from Geofabrik, in this case we will use Italy: https://download.geofabrik.de/europe/italy.html
Under other formats and auxiliary files let's download the italy-latest.osm.bz2 and extract it, this will allow us to get the entire Italian dataset.
This is of course also available for most countries so you can instead pick any place you prefer.
Once downloaded and extracted, let's open the OSM file in Alteryx:
Alteryx can load it as XML so let's use this as input format.
Unfortunately reading the file as XML is extremely slow, so let's make some steps to make the dataset more manageable:
First of all, we will make a new key field by concatenating latitude and longitude so that we will be able to translate the features to a single cetroid.
As second step, we will remove any lines without cohordinates and after that any key field without features (defined as tag_k and tag_v).
This step may take several hours on a full country, so it's best to do it overnight or be prepared for a long wait, for testing purposes we will actually use only the north-western Italian dataset.
Once done, let's load the yxdb file into a new workflow and prepare the data for extraction.
Depending on the country file you chose, you might find a hundred "tag" columns or more, each "tag_k" represents the variable type, while "tag_v" is the actual content.
In order to make it useable, we first need to find a way to rename the columns and assign them their values, that's where the transpose tool can help us:
Using latitude, longitude and the "latlon" key field we created, we will put the various tags in a single column, ready to be cleaned up.
Let's also get rid of empty fields by filtering out empty instances of the created "value" field, preparing ourselves for the next step.
The end result will look like this:
This is almost good enough, what we need is a way to put column names and values on the same row.
First of all, let's create fields for column names and values:
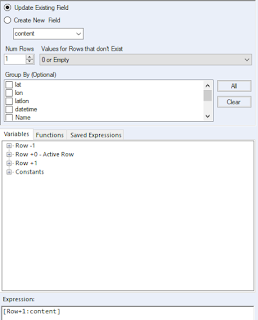
With that done, let's shift values up one row so that they are on the same row as column names:
Filtering out the new empty values, the final result should look like this:
There will be some duplicate values, so what's suggested is to do a summarize on this table and choose how to deal with column names with multiple values for the same latnlon key.
All you need now is a simple crosstab to get your columns with the correct values inside:
The final result will look similar to this:
Most points will have pretty sparse data but with some further cleaning and good filtering you can still get lots of data points for any single column!
This concludes our tutorial, stay tuned for our next article!


No comments:
Post a Comment